
CandleStick Pattern Trading Strategy
How to make $25 per hour in Philippines using Candlestick pattern trading strategy?
Candlestick patterns are easy to follow and understand. Try them while trading Fixed Time Return Investment with IQ Option.Most of the new traders open a trading account and stop trading almost immediately after losing money. This is because of two reasons:
- They don’t know how to trade profitability,
- They don’t know how to trade at all.
And, sadly, people leave the trading platform after losing money.
Here is the Candlestick Pattern Trading Strategy that can help you trade better and earn $25 per hour in the Philippines.
What if I tell you that many easy-to-use strategies have the potential to make money with online trading platforms like IQ Option, Olymp Trade, Pocket Option, and Expert Option? Would you like to consider trying them by opening an account?
Here, we discuss the Candlestick Pattern trading strategy and see its potential to make $25 per hour in the Philippines.
Recent Posts
What is the Candlestick pattern strategy and how to use this?
Among so many strategies, this one is simple to use and less talked about strategy. But it is powerful and has the great potential of making money online. You can check out the other strategies like 3Indicators and Quick Reversal Strategy.
The Candlestick pattern strategy involves identifying the formation of particular candlestick patterns. The trader must trade only when such patterns appear, otherwise no trading.
In this strategy, we look for the formation of a candlestick which is of a different color than the two previous candles and that covers the previous two candles.
To begin with this trading strategy, the first thing you require is access to a trading platform. Sign up with any of the trading platform below –
1. Sign up for a Free Demo Account or Live Account.
If you don’t have an account yet, sign in to your account or register for one with IQ Option, Quotex, Pocket Option, and Expert Option brokers.


2. Set up your chart for the Candlestick Pattern Strategy.
After you log in, you will find either an Area Chart or a Candlestick Chart. If you find the area chart, switch to Candlesticks by clicking Japanese Candlesticks. You can bring in candlestick charts by clicking on the candlestick symbol, as shown in the screenshot below.
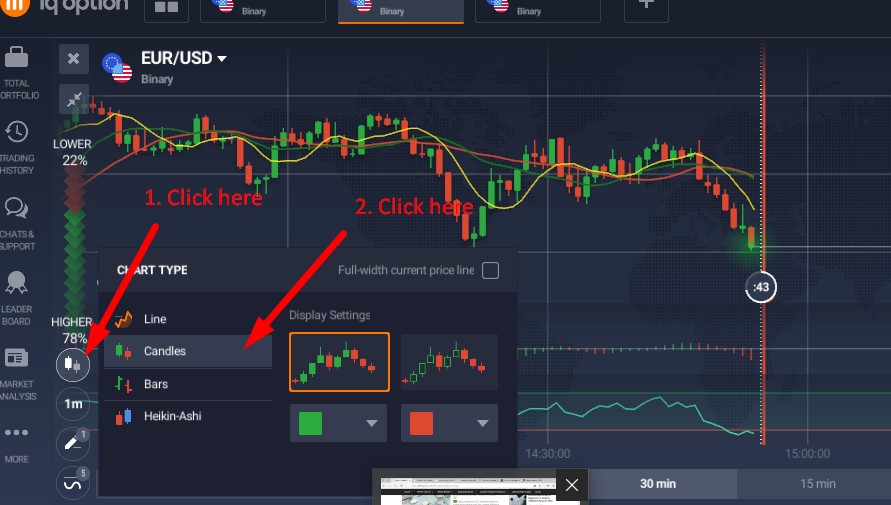
You can select the Candlestick chart by clicking the Candlesticks symbol as shown above.
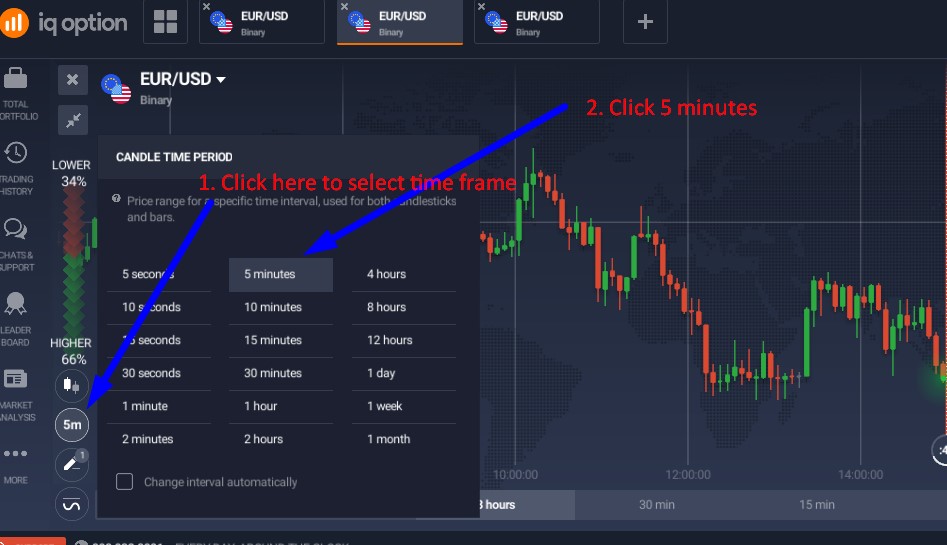
Have you selected the Candlesticks chart? Now it is time to set the time frame to 5 minutes in the chart. You have to click the candle time period button and select 5 minutes as shown in the below image.
Set your trading time to 10 minutes or 15 minutes expiry. While trading with IQ Option, select the nearest expiry within 10 or 15 minutes. If you are trading with Quotex, select the nearest 15minutes expiry.
3. Identify the pattern and place your trade.
How to find the correct Candlestick pattern setup to enter the market?
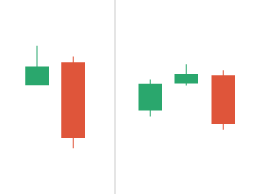
The series of Red and Green candles in the above images represent the underlying asset’s price, i.e., EUR/USD. A green candle indicates that the price has risen in that particular period, and a red candle means that the price has fallen. When several candles of the same color form in continuation, we call it a trend. The trend is positive if a series of green candles forms and negative if a series of red candles forms.
The candlestick pattern trading strategy is based on watching the color and size of the candles. There are a few typical formations that indicate a potential trading opportunity. We discuss all of them below –
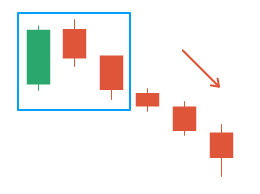
Downtrends – Selling opportunity
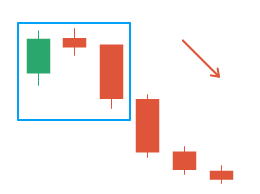
1. Downtrend formation Type 1
When a Red Candle is formed and it covers the body of the previous one or two candles as shown below. It is a SELL signal.
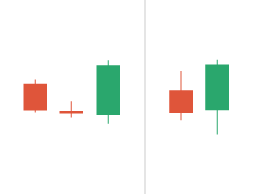
2. Downtrend formation type 2
When there are two small red candlesticks formed and have covered the previous green candle. This indicates a downtrend and a SELL Signal.
3. Downtrend Type 3
When there are two red candlesticks of different sizes and have covered the previous green candle. This indicates a downtrend and a SELL Signal.
Uptrends – Buying opportunity
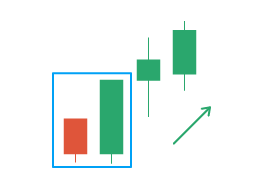
Uptrend Formation Type 1
When a green candle is formed which covers the size of the previous 1 or two red candles, it is an uptrend. This gives a BUY Signal.
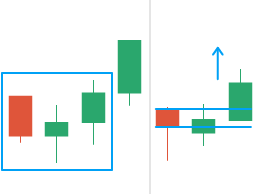
Uptrend Formation Type 2
When two green candles together cover the size of the previous red candle, it is an uptrend. This gives a BUY Signal.
Uptrend Formation Type 3
When a green candle is formed which covers the size of the previous red candle, it is an uptrend. This gives a BUY Signal.
How to open a profitable trade based on the above Candlestick patterns?
As shown above, you must wait until a Red or Green candlestick formation occurs. Then, place a trade with an expiration of at least equal or double the candlestick time frame. If you have set the candlestick to a 5 5-minute timeframe, then the trades should expire at either 5, 10, or 15 minutes.
How to make $25 per hour using the candlestick pattern strategy?
The above strategy has the potential to make you $25 per hour when you start trading while following the strategy.
- Open an account with IQ Option or Binomo
- Fund your account with $100 or more
- Strictly follow the strategy on 4 charts
- Trade only when you see a pattern as above
Make sure to set the candlestick timeframe to 5 minutes or more. Place the trades with expiry equal or double the candlestick timeframe.
Risk Warning: The information provided here does not constitute a recommendation to carry out business or investment. While using the information provided here, you are solely for your decisions and assume all the risks associated with the financial result of such transactions. We may have an affiliate agreement with the brands or companies mentioned here.